What is A/B Testing?
A/B Testing allows you to compare multiple versions of a display to see which one performs better with your visitors. When anyone visits a relevant page, a predefined ratio of the traffic will see each variation, and you’ll see how each version performs by comparing engagement analytics such as the views, signups, and signup rate rate.What kinds of things should I test?
Changes that often result in the most significant changes in visitor behavior include the following:Offer
Test out different discount amounts, % off vs. $ off, or discount vs. no discount.
Header
Try out different copy, such as “Get 10% off” vs. “Join the crew!”
Design
Test out a different layout or different colors to see which performs best.
Image
Test out different images (product vs. lifestyle), or try image vs. no image.
Call-To-Action
Test out the color and/or copy on your button (“Get 10% off” vs. “Subscribe”)
Settings + Targeting
Try different time delays or audience targeting to see if it makes a difference.
Create an A/B Test
To start a new A/B Test:- Navigate to Displays > A/B Tests in your Privy dashboard.
- Click the New A/B Test in the upper right.
- In the prompt, provide a name for the experiment, select which display you’d like to test from the dropdown menu, and then click the Create experiment button.
Edit test settings
To adjust how long your test will run for:- Click on Test settings.
- Choose to end the testing after a set amount of time or after a set number of participants. Save.
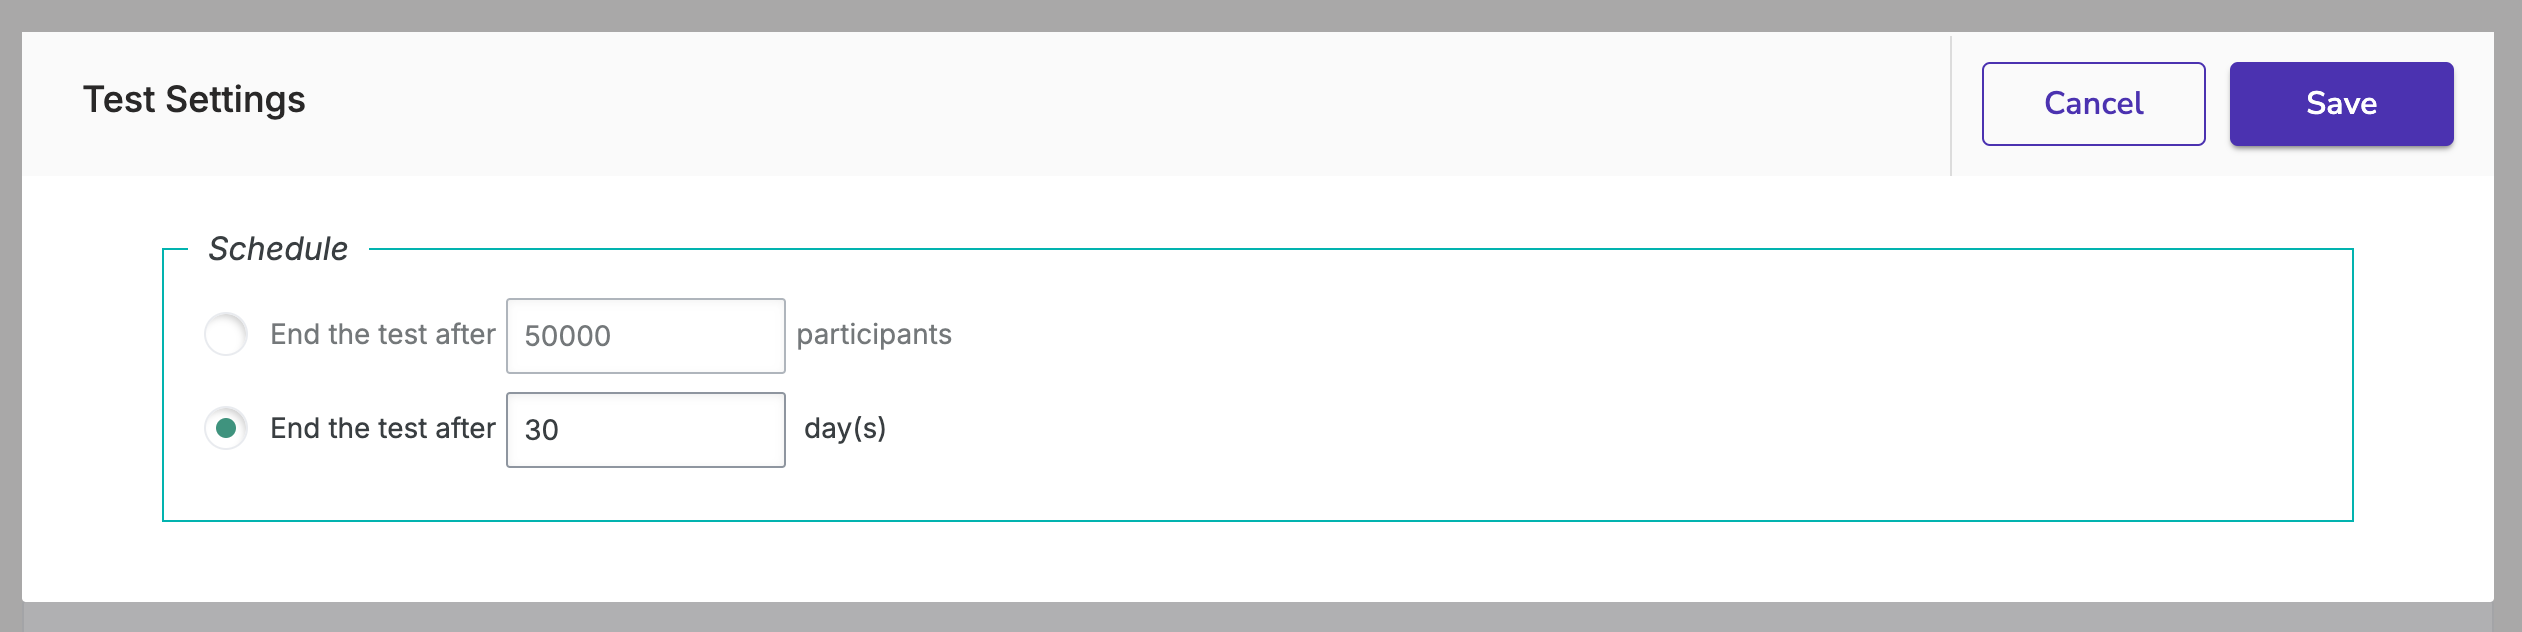
Note: “Participants” is regarding your total traffic on your site.
- Click into your Original variation.
- Provide an internal name, set a traffic ratio, and Save.
Note: Leaving the traffic ratio to 1 will divide the traffic evenly across all variants. Once you update the traffic ratio of one variant, the rest of the traffic percentages will update automatically.
Add a variation
To add a variation to your test:- Select the Add Variation option.
- Provide an internal name for the variant, and then click the Create Variation button. This will bring you to the display editor.
- The variant will start as an exact copy of the original display so that you can control what changes, from the settings to the design. Make the desired changes and Save.
- Head back to Displays > A/B Tests to return to your test.
- Add additional variations if desired by repeating the previous steps.
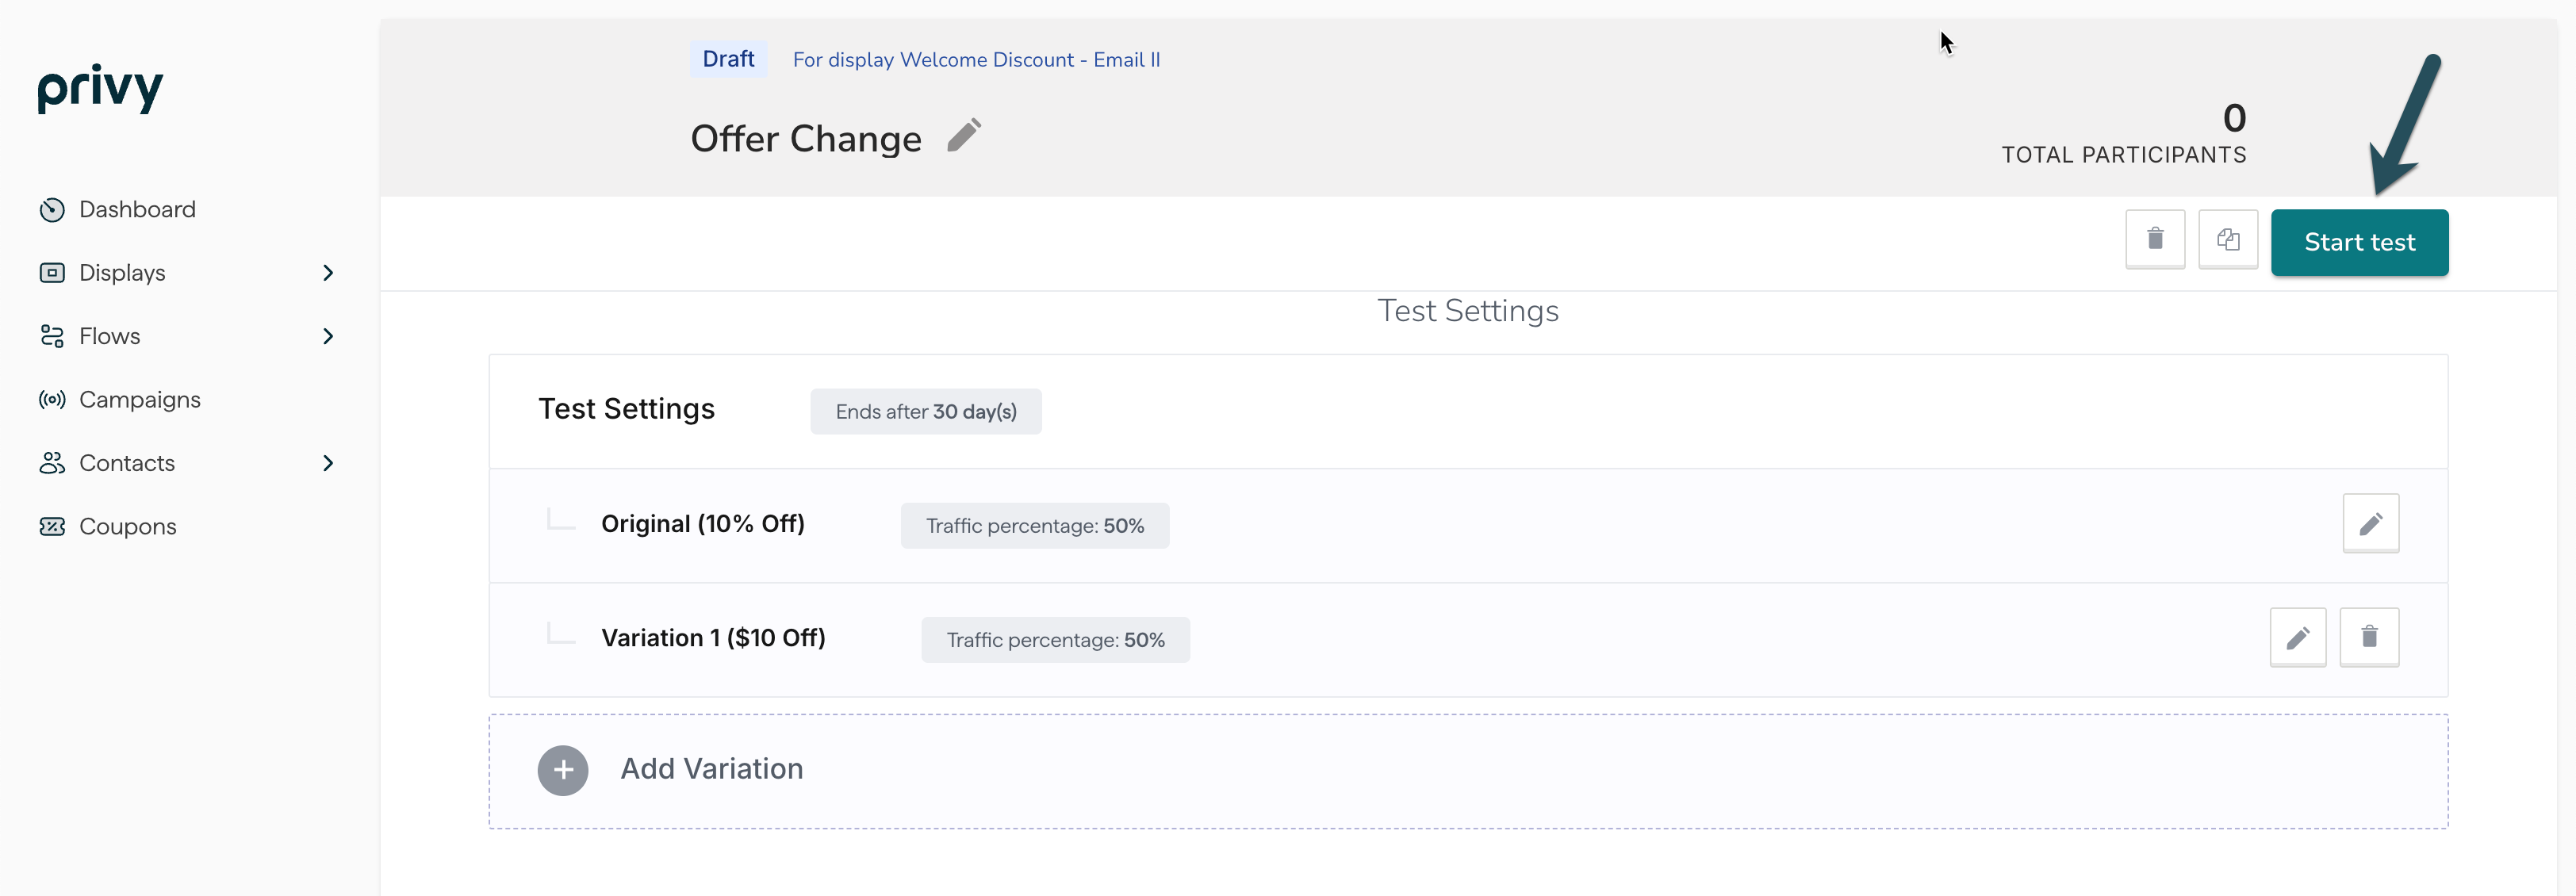
Start your test
Once you’ve configured the test’s settings and created the desired variations:- Select the Start test button at the top right of the A/B test builder to launch the experiment.
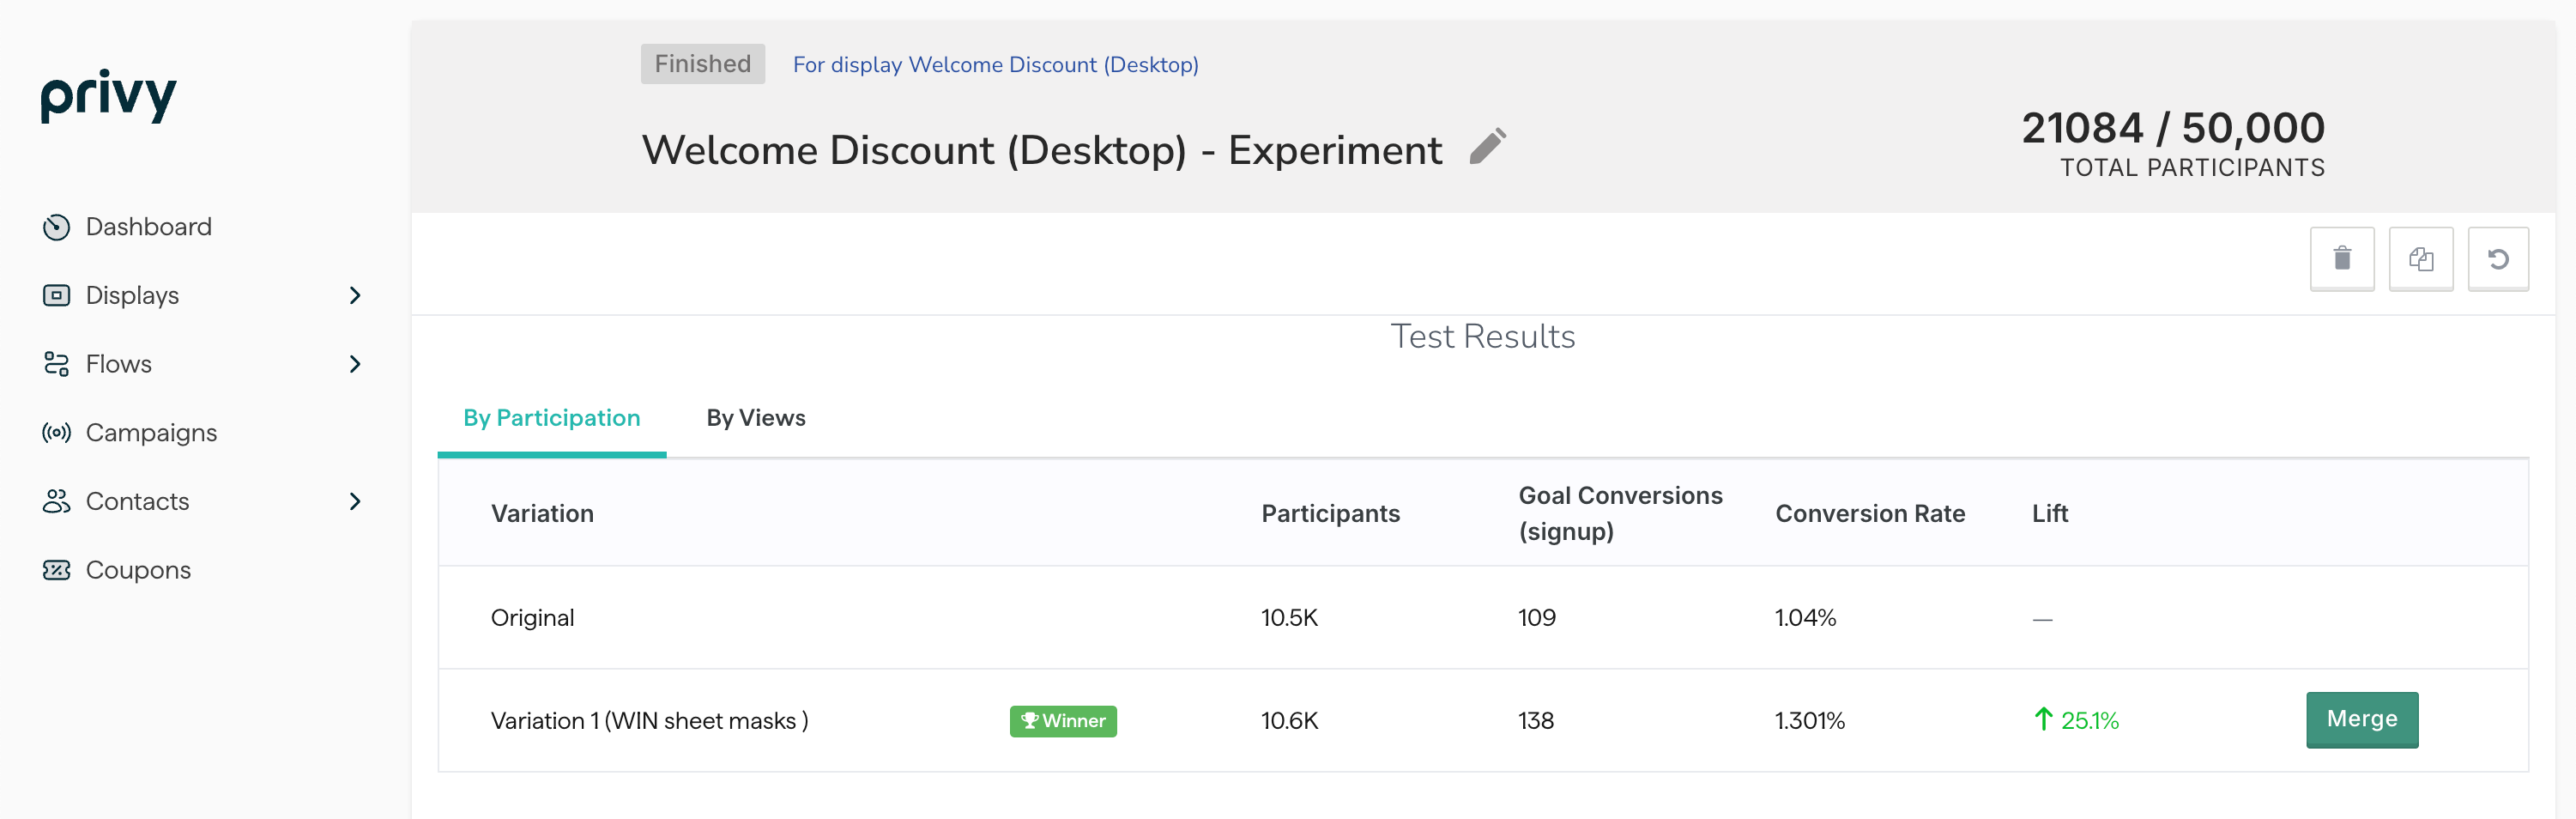
Review your results
Once an A/B Test is launched, you can check in on the results at any time. To review the result of an ongoing or finalized A/B test, navigate to Displays > A/B Tests and select the desired experiment. A summary of the experiment will outline various performance metrics, including the views, signups, and conversion rates broken down by participation and views.Note: “Participants” is regarding your total traffic on your site. Views will only show your metrics from visitors who viewed the displays from this experiment.