Campaigns Table
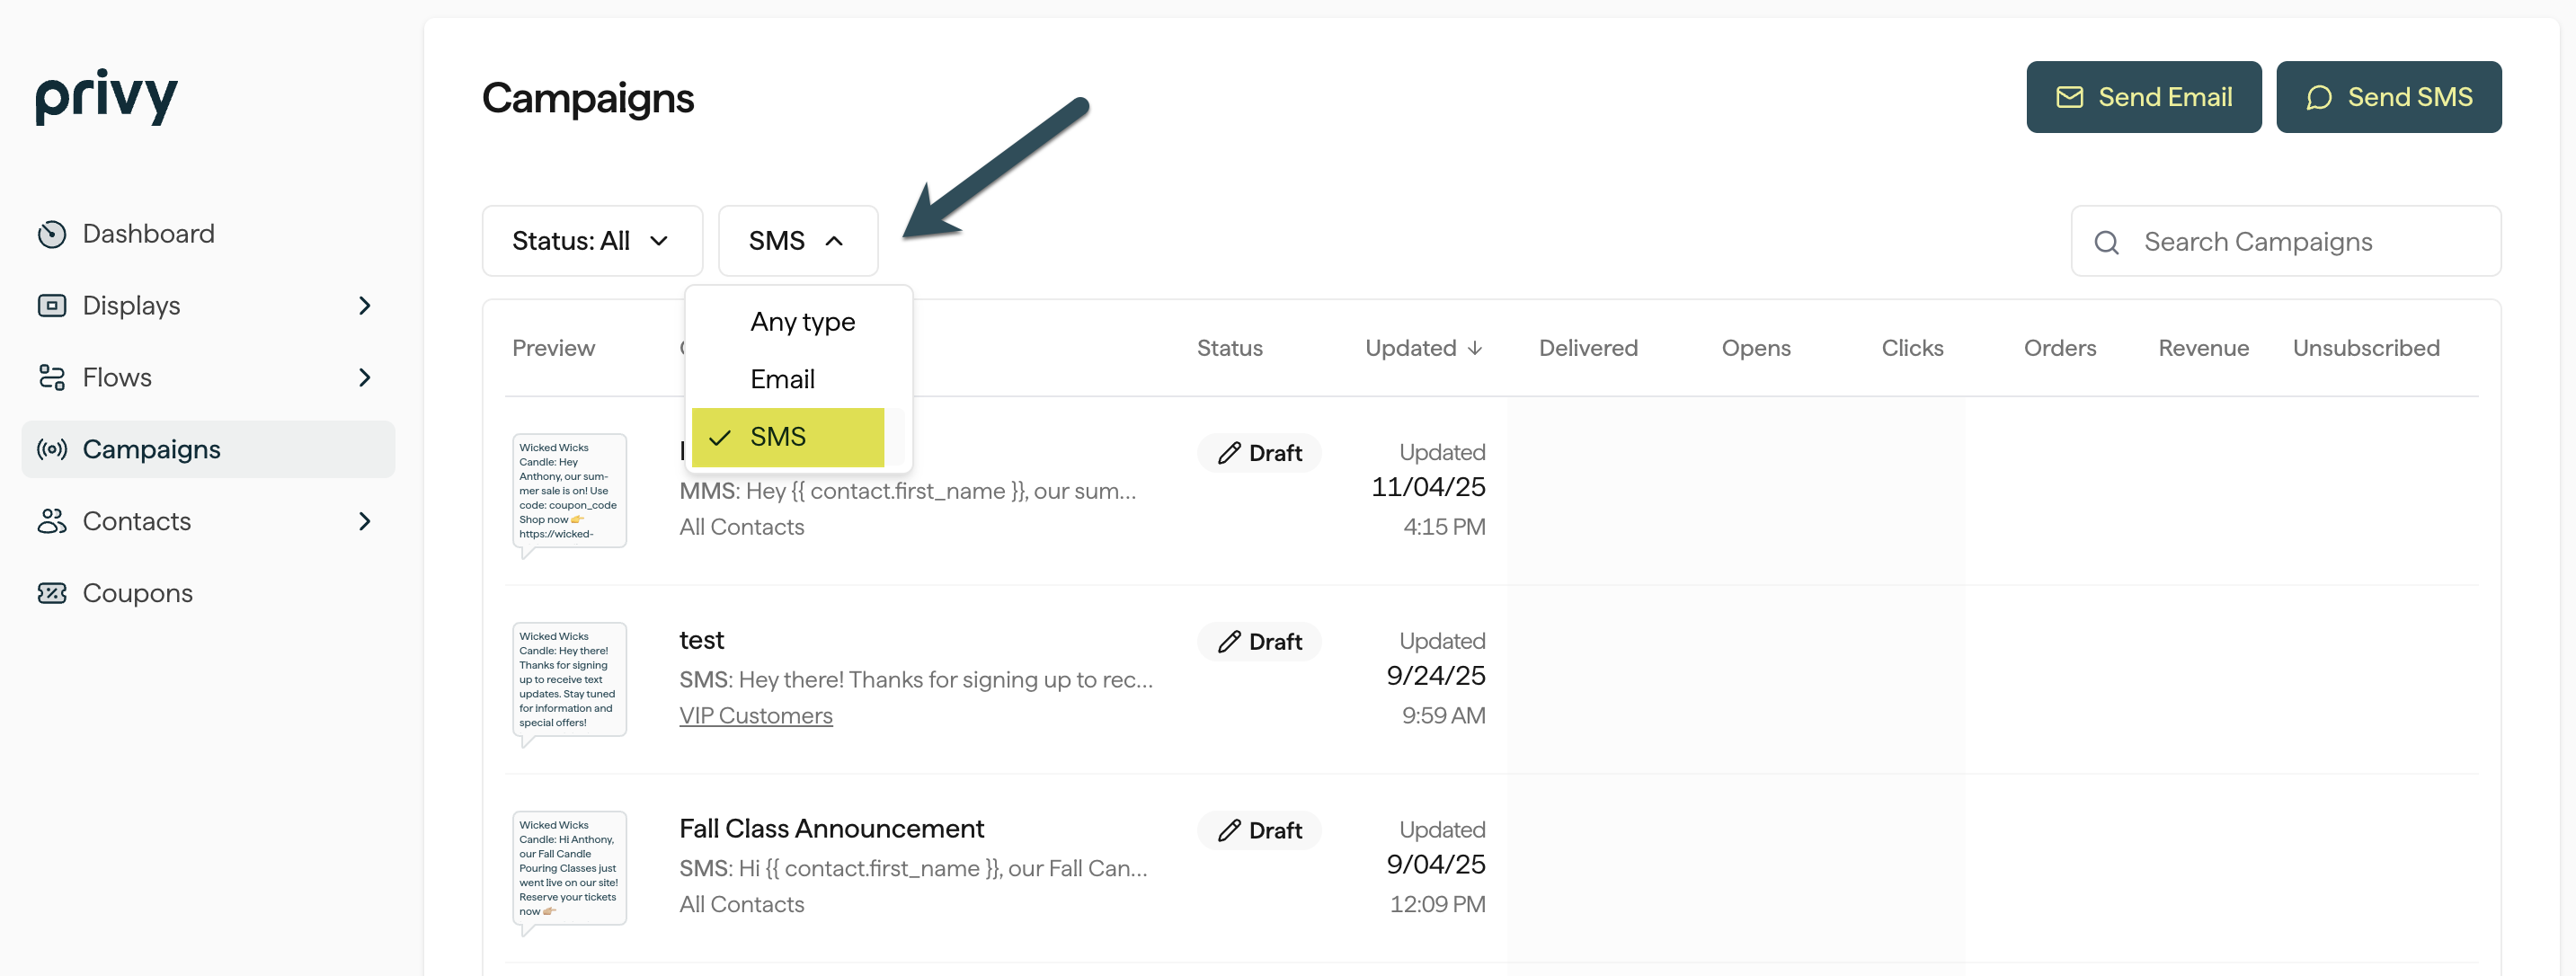
To get an overview of your text campaigns’ metrics:- Navigate to Campaigns.
- To narrow down your view of your Campaigns table, you can use the Search and Filter functions at the top of the table to narrow down by status and message type. For example, if you only want to view your Sent text campaigns, you’ll want to filter by Status: Sent and Type: SMS.
Delivered
Delivered
The total number of text messages delivered to your recipient’s phone.
Clicked
Clicked
The total number of contacts who received your text message and clicked on your short link.
Unsubscribed
Unsubscribed
The total number of contacts who received your text message and replied ‘STOP’ to unsubscribe from all future messages.
Revenue
Revenue
The total revenue collected from this text message. Privy uses a last-touch model with a 7-day attribution window. If a customer has opened/clicked multiple emails and texts within the seven days proceeding a purchase, the revenue will only count toward the message they most recently engaged with.
Text Campaign Reporting Page
To take a deeper dive into an individual text message’s engagement, delivery, and revenue:- Locate and select the desired text campaign. This will open your text campaign’s reporting page.
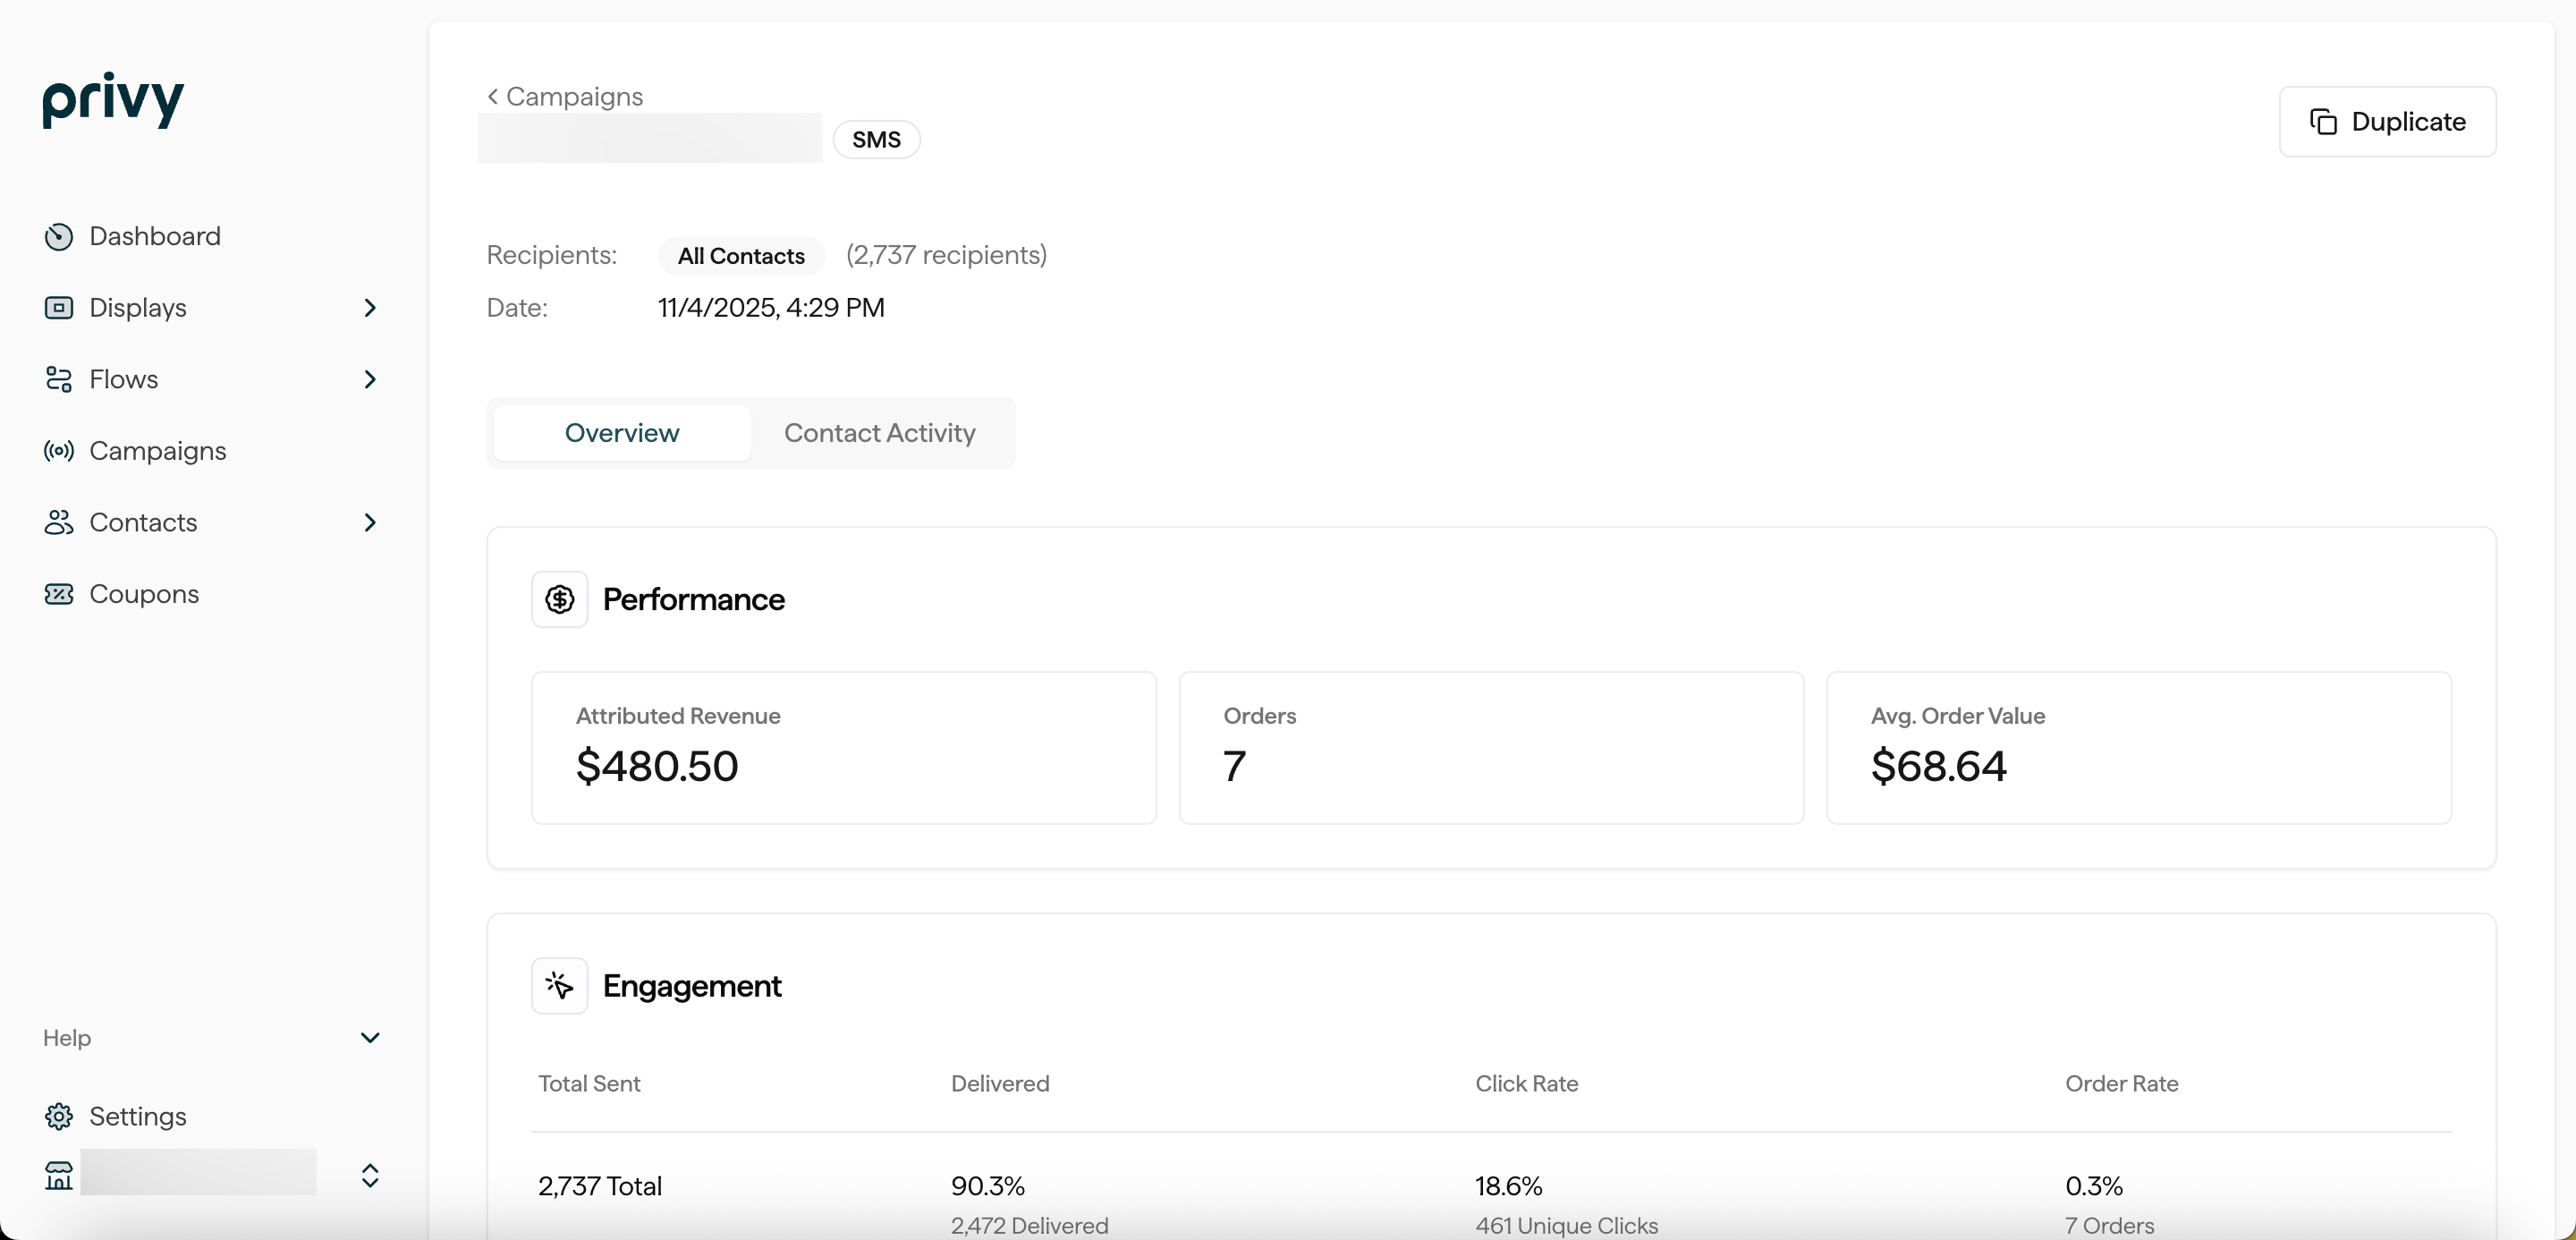
Performance
Below your text message’s preview, you’ll see a breakdown of your revenue metrics: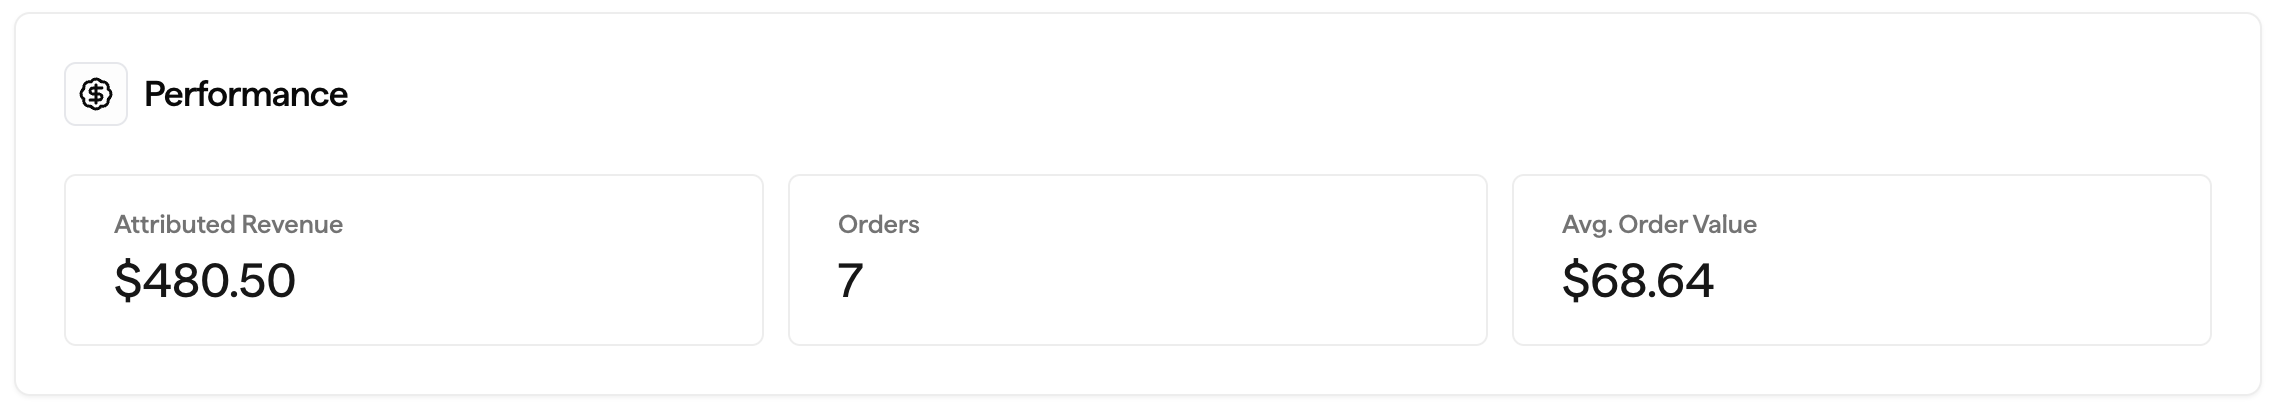
Attributed Revenue
Attributed Revenue
The total revenue collected from this text message.
Orders
Orders
The number of individual orders attributed to this text message.
Average Order Value
Average Order Value
The total revenue divided by the number of orders attributed to this text message.
Engagement
Below your revenue reporting will be the following engagement metrics: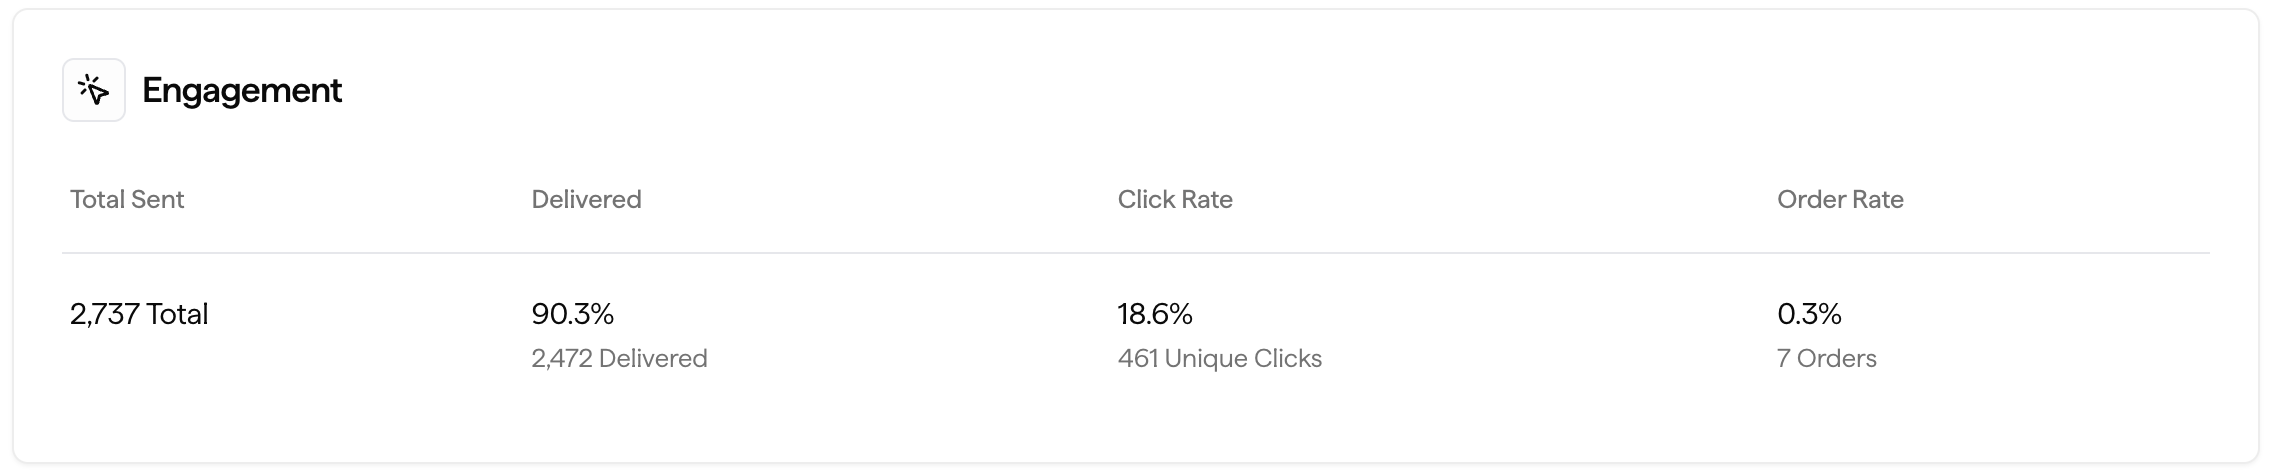
Total Sent
Total Sent
The total number of textable contacts that your message was sent to.
Delivered
Delivered
The total number of messages that successfully delivered to your recipients.
Failed
Failed
The number of messages that were not successfully delivered to your recipients. Just like email marketing, delivery failures can happen for a number of reasons. Some of the most common reasons are: invalid numbers, roaming, carrier restrictions, or network issues.
Clicked
Clicked
The total number of contacts who received this text message and clicked on the short link.
Opted Out
Opted Out
The total number of contacts that responded to this text message with the word ‘STOP’ in order to unsubscribe from future messages.
Deliverability + Content
Below your Engagement card, you will find your Deliverability metrics, as well as a preview of your message Content:Delivered
Delivered
The total number of messages that successfully delivered to your recipients.
Failed
Failed
The number of messages that were not successfully delivered to your recipients. Just like email marketing, delivery failures can happen for a number of reasons. Some of the most common reasons are: invalid numbers, roaming, carrier restrictions, or network issues.
Opted Out
Opted Out
The total number of contacts that responded to this text message with the word ‘STOP’ in order to unsubscribe from future messages.
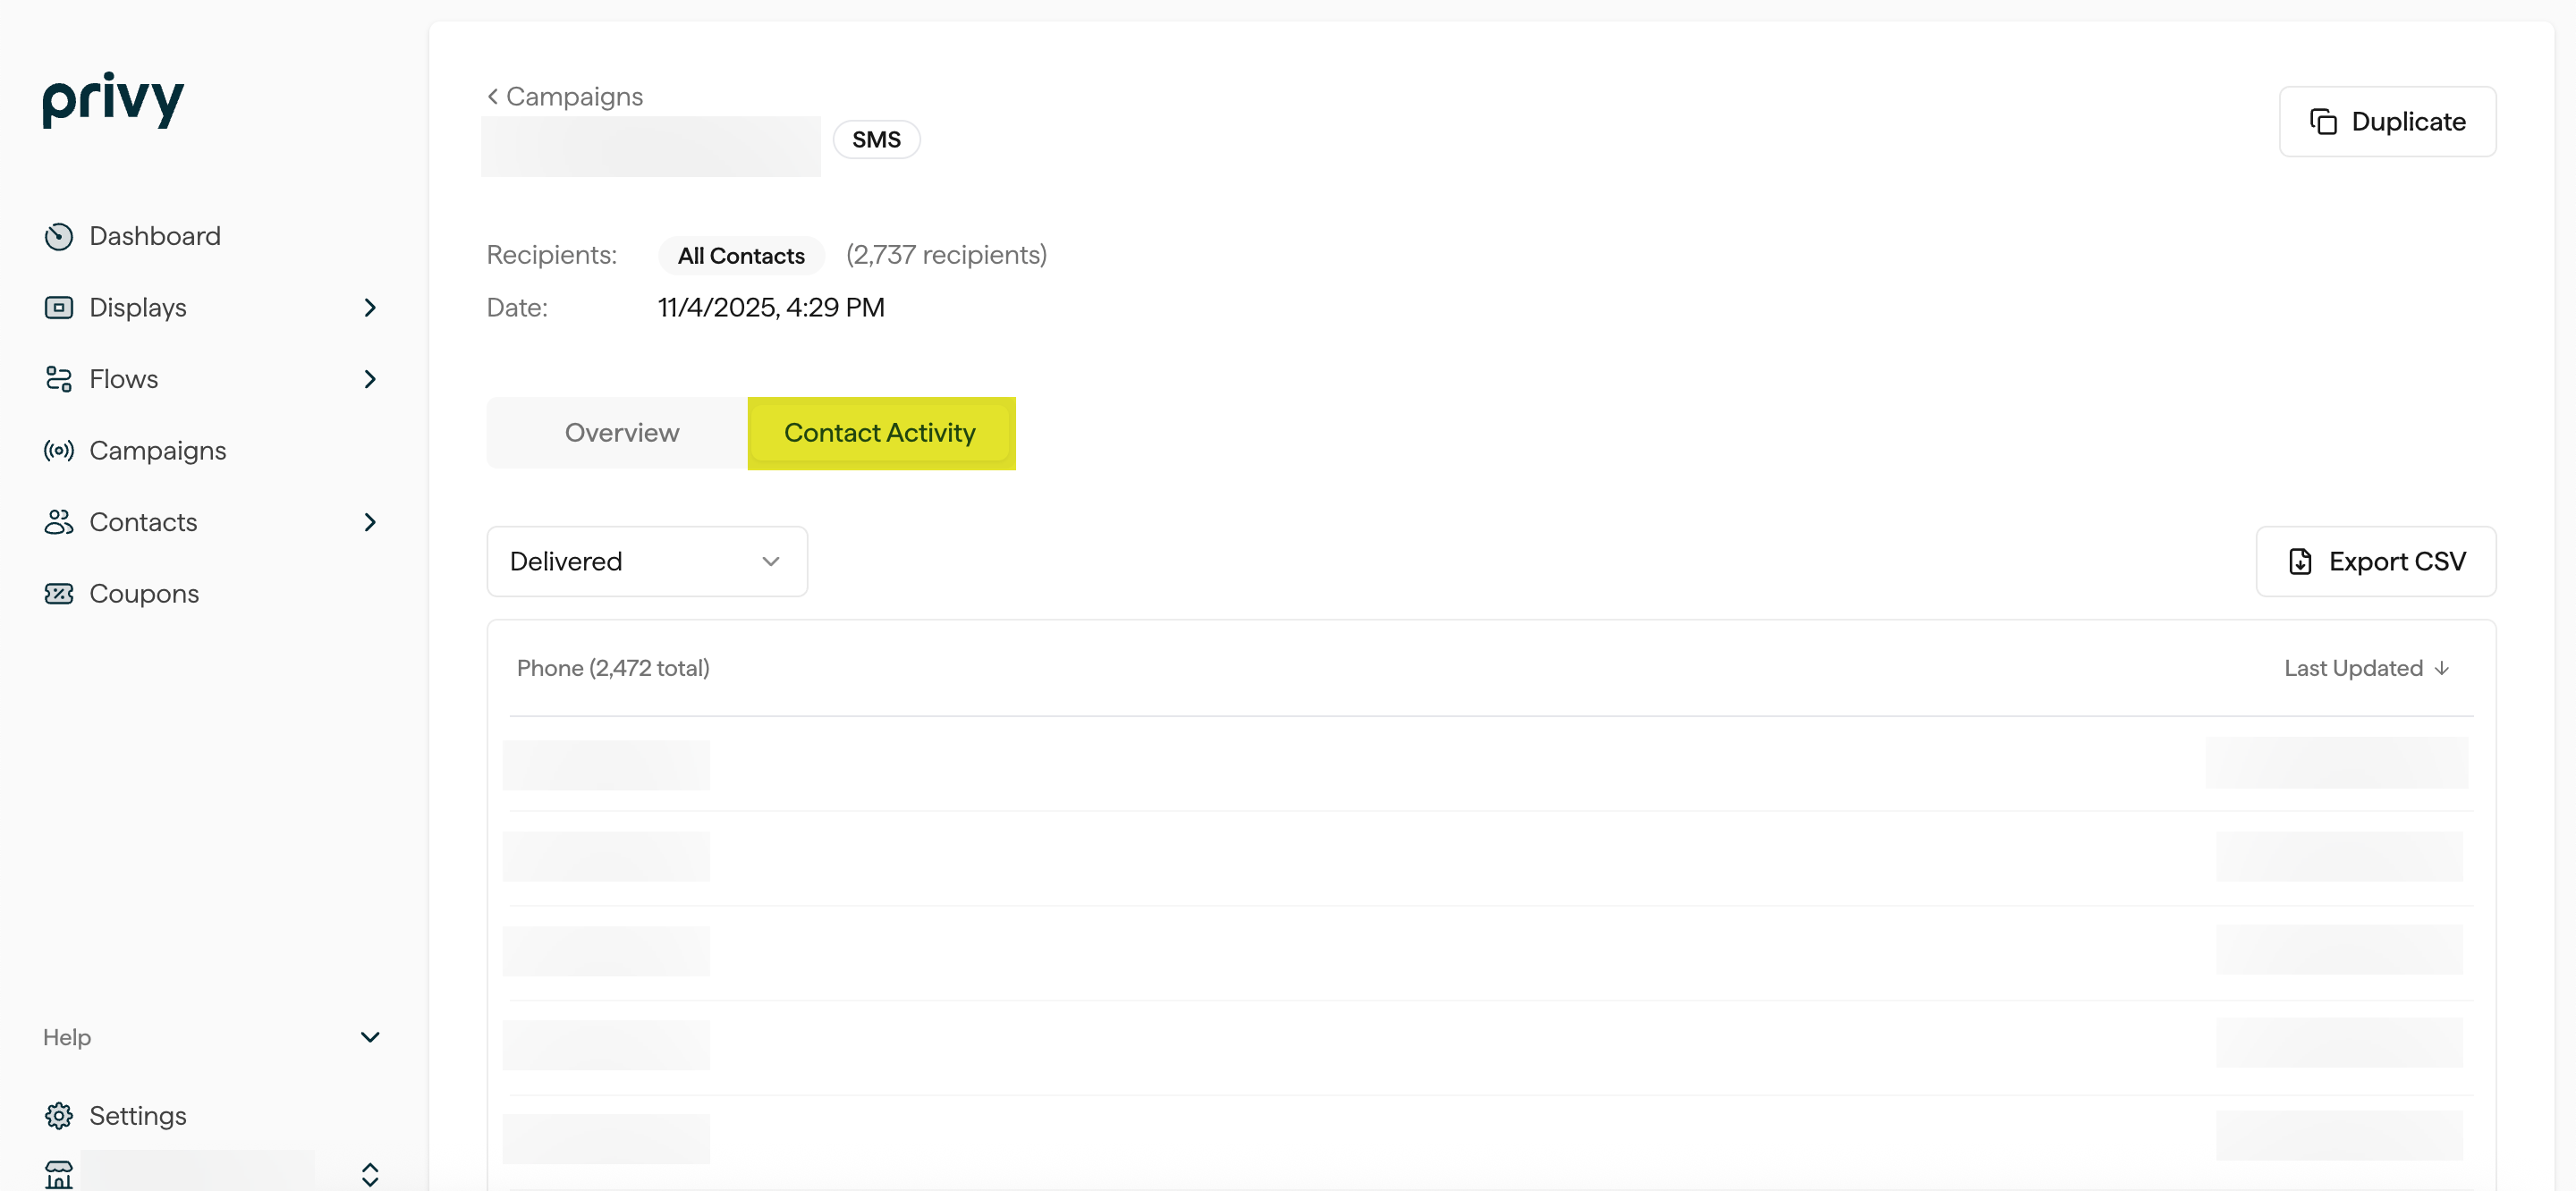
Contact Activity
Lastly, you also have a Contact Activity tab which can be found near the top of your SMS Campaign’s reporting page. This tab displays a table with each of your text recipients, along with the options to:- Filter by activity (delivered, sent, clicked, unsubscribed, or ordered)
- Export to CSV.