Welcome to Privy
Your all-in-one e-commerce marketing platform.
Get Started
New to Privy? Let’s get you set up for success.
Quickstart
Everything you need to set up your account and start driving revenue right away.
Popular articles
Billing, Payments, and Refunds
Display Targeting + Settings
Tips to Improve Deliverability
Coupon Codes
Email Authentication
Segments 101
Explore our features
Discover user-friendly + effective tools built to grow your business.

Grow your list
Create & launch eye-catching displays to convert your site visitors into subscribers.
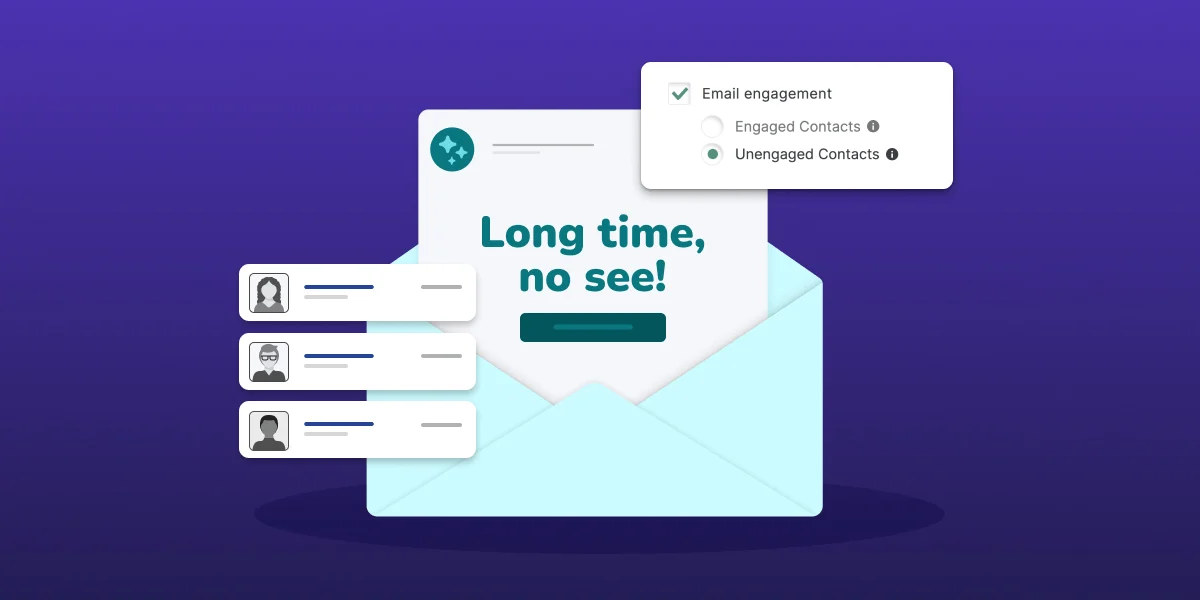
Automate your email strategy
Trigger personalized messaging based on your subscribers’ behavior.
Send personalized emails
Create & send emails to engage with your audience and drive revenue for your store.
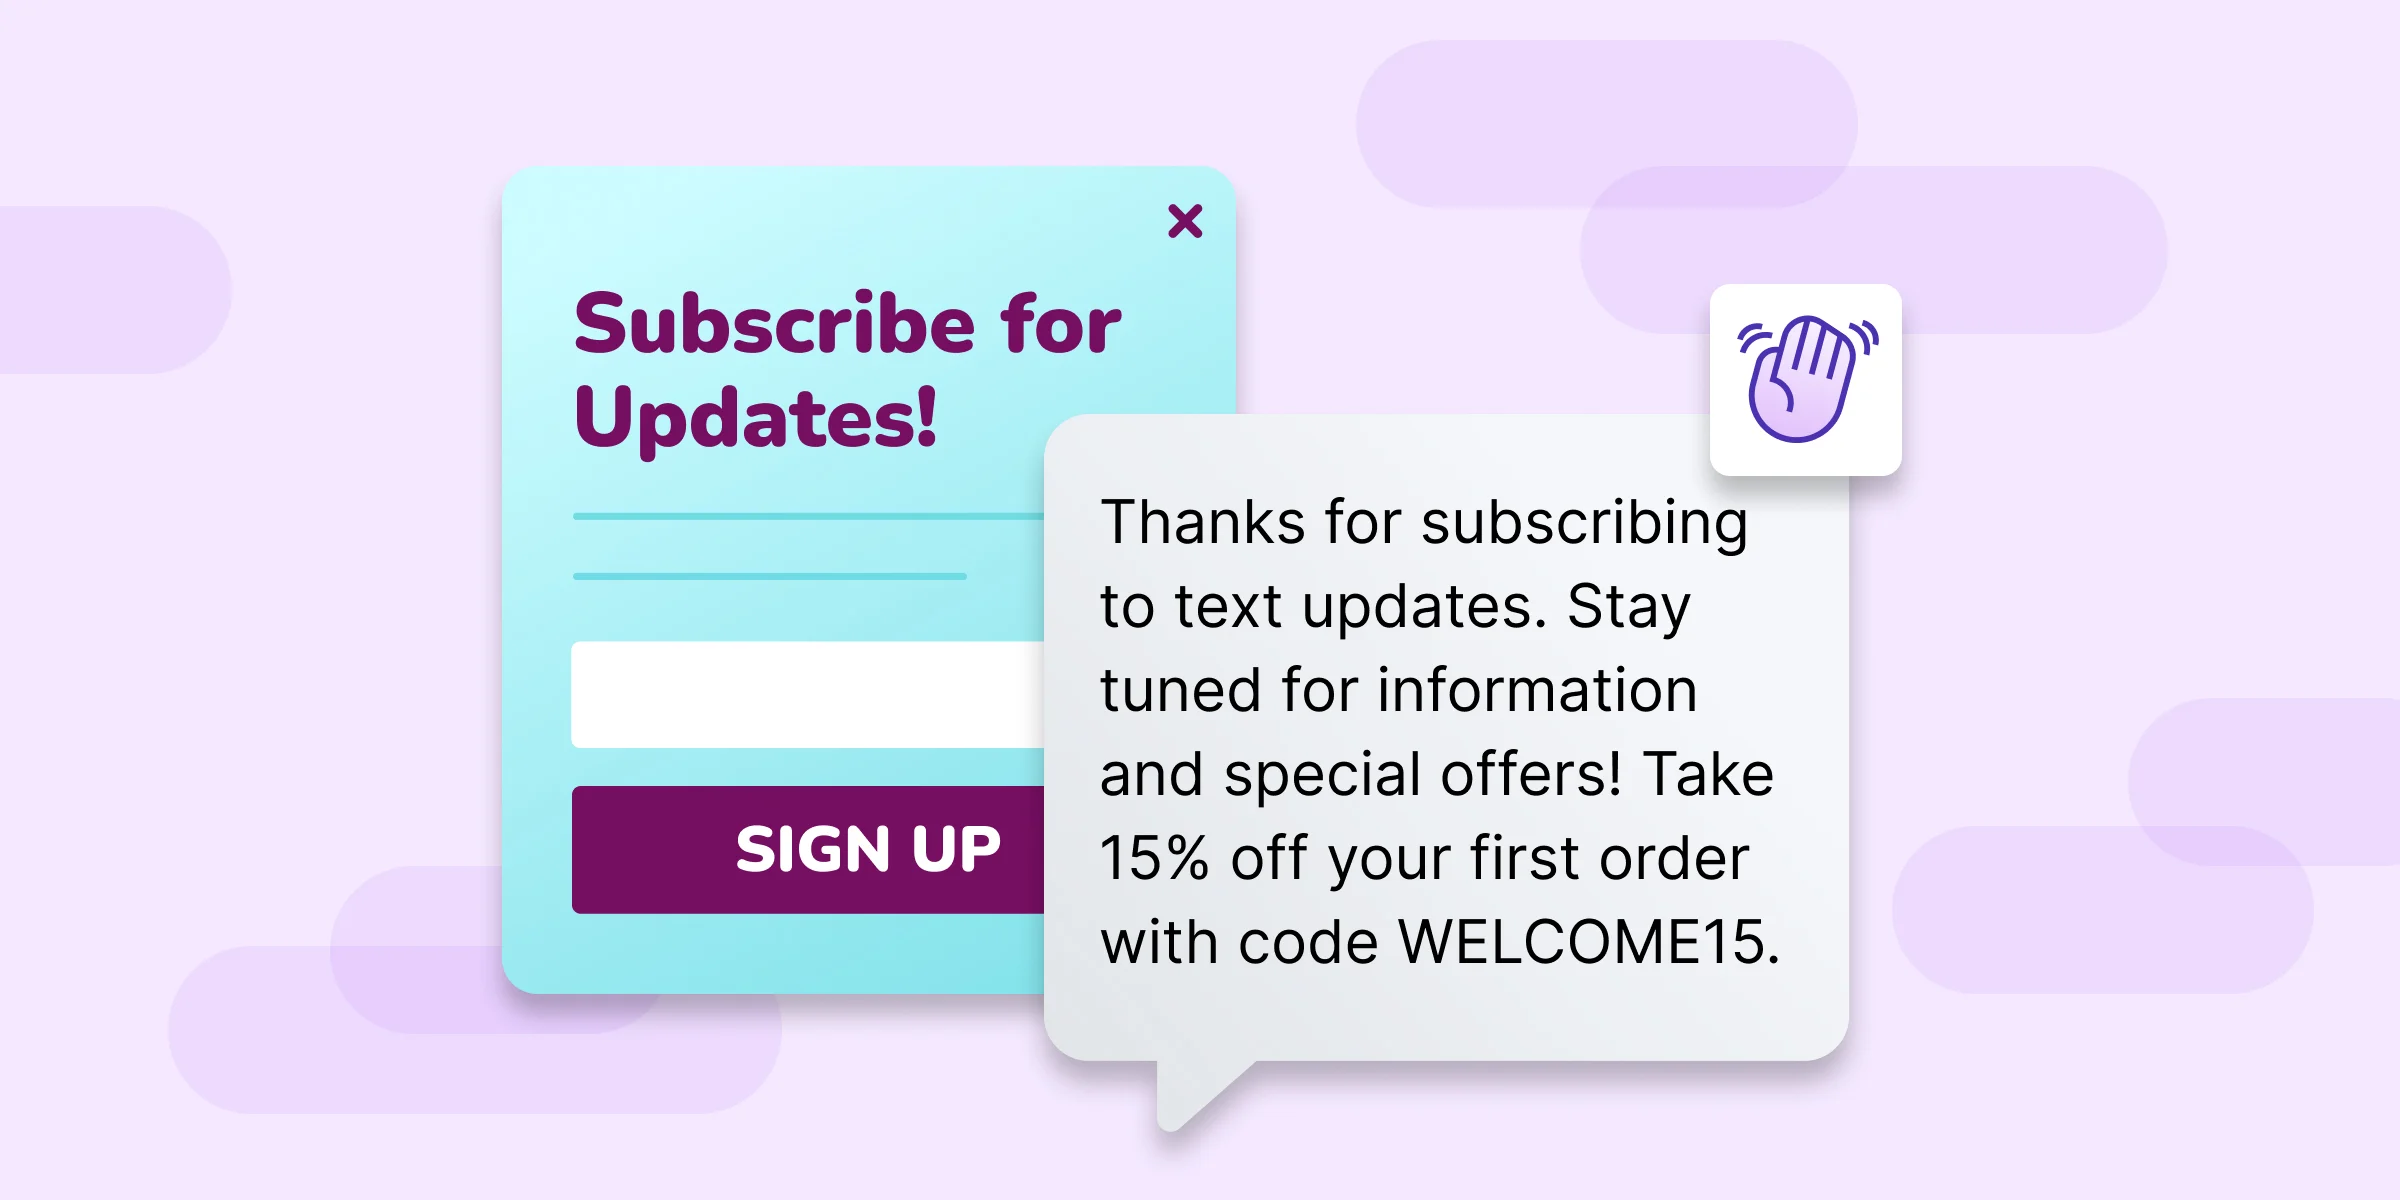
Drive revenue with SMS
Send text messages to notify your most engaged customers about deals + drops.
Learn more
Strategy Guides
Look no further for inspiration, ideas, and guidance on proven best practices.
Additional Support
Still have questions? For assistance with your account, send our Support Team an email or send us a Live Chat from your dashboard.